
3.3.1What does tell me?
Curve Constructor: Part One
Knowing if a function increases or decreases tells us something, but not everything, about its possible shape.
Draw an example of a function that is increasing everywhere. What type of function behaves like this? Is there more than one possible shape?
Draw an example of a function that is decreasing, then increasing, then decreasing again. What type of function behaves like this?
What type of function infinitely alternates between increasing and decreasing?
One of the functions below is
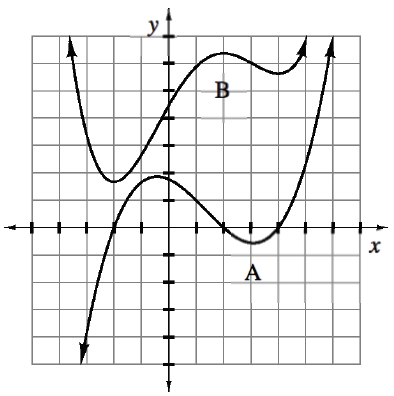
Use the graph of
At what values of
does change from increasing to decreasing or decreasing to increasing? What is at these points? State the intervals where
is increasing. What is true about over these intervals? Using your answers from parts (a) and (b), sketch the graph of
.
.png)
Sketch the slope function for each function below.
.png)
.png)
.png)
What happens to the slope at a corner (called a cusp)?
CURVE CONSTRUCTOR, Part One
Computers often have drawing programs that allow users to create pictures and diagrams. Your firm is designing software that will allow users to construct curves so they do not have to draw them by hand.
As the main software designer, you need to provide the user the option of drawing all different kinds of curves.
Your boss has asked you to design a set of four screen icons that will create arcs by clicking and dragging. The direction and size of the arc depends on where you click and where you drag the mouse. The user can use this button to create each part of a long, interesting curve.
Consider all the ways that you can sketch a curve from one corner of a square to the opposite corner. Sketch these on sticky notes. Are four icons enough, or do you need more? Explain.
Get creative! Without rotating the sticky notes, connect them head to tail to create as many different known functions as you can. Can you build a parabola, a cubic, an exponential function? What else can you create?
Your first assignment as a graphic designer is to use these four icons (the four curves of calculus) to sketch
over the interval . Which icons will you select, and in which order? Work with your team to build the sine wave by connecting the sticky notes. Then sketch it on your paper—be sure to identify the points where one arc begins and another ends. Under each curve of the sine wave, answer these questions about
on that domain. Is
positive or negative? Increasing or decreasing? Concave up or concave down? Is
positive or negative? Increasing or decreasing? Is
positive or negative?
.png)

Using the statement below, identify where the slope of the function is positive, negative, and zero.
“The function increases from negative infinity until it reaches a peak at
then decreases until where the graph turns and then increases until positive infinity.” Homework Help ✎
Name all point(s) on the graph at right that meet the given criteria. 3-89 HW eTool. Homework Help ✎
The slope of the tangent line is most positive.
The slope of the tangent line is negative.
The slope of the tangent line is the most negative.
.png)
The graph below shows the distance from a fixed point traveled by a toy car. Use the graph to sketch the velocity of the car. Homework Help ✎
.png)
Graph the function
Approximate the area under the curve for
using four trapezoids. Write a Riemann sum to approximate the area under the curve for
using four left endpoint rectangles. Then, use the summation feature of your graphing calculator to evaluate the sum. Compare the accuracy of the trapezoids and the rectangles. Will the approximation with trapezoids always equal the approximation with rectangles for all functions? Why or why not?
While using the definition of a derivative, Lulu used the following limit. For what function was she determining the derivative? How can you tell? Without simplifying this expression, determine the limit. Homework Help ✎
If
Show that if
Evaluate each limit. If the limit does not exist due to a vertical asymptote, then add an approach statement stating if y is approaching negative or positive infinity. Homework Help ✎
Use the limits above to describe the shape of the graph of
. State all horizontal asymptotes, vertical asymptotes, and holes.


